Insights
April 2024March 2024 Jan 2024 Dec 2023 Nov 2023
- Do credit unions really need five companies to manage $18B of statutory liquidity?
- The PSCU-Co-op mega-merger: Three (hard) lessons for Canadian credit unions
- For Saskatchewan's credit unions, what comes after Concentra?
- Credit unions are getting leaner - and need to keep going
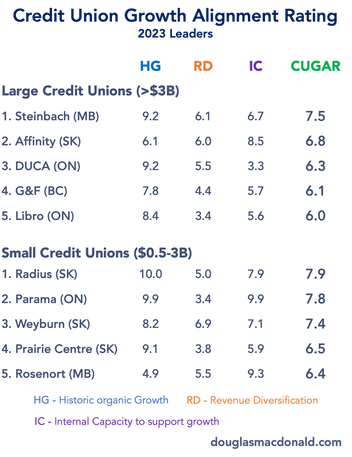
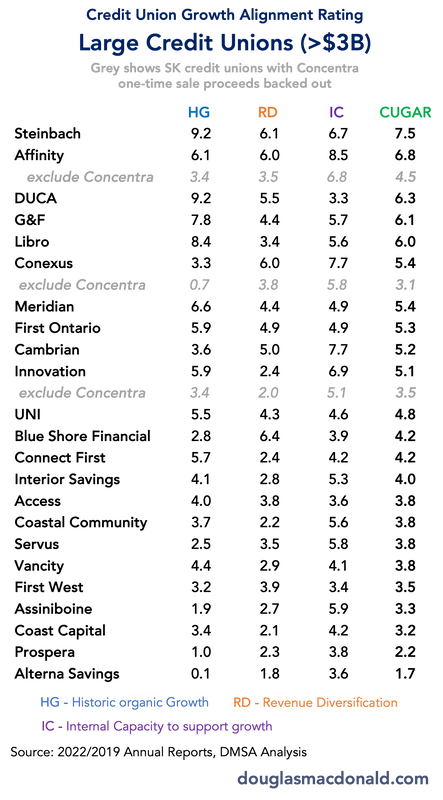
- Here are Canada's credit union growth leaders
- Introducing CUGAR: Recognizing credit unions built for growth


 RSS Feed